Free NinjaTrader 8 Indicators
Open-source trading tools by PhillyFrank
MIT License - Free ForeverStrategies

NT8 Strategy Downloads Coming Soon
"The same strategies competing in the Eval Arena - headed to the Shed."
The trading strategies you see battling through simulated $50K evaluations on the live broadcast are built as native NinjaTrader 8 strategy files. We're preparing them for free download right here - once the first strategies finish their arena runs, this section opens up.
- Native NinjaScript strategy files - no external dependencies
- The exact logic competing on the Eval Arena scoreboard
- Session-aware: Asian, European, and US variants
- Free and open source, like everything else in the Shed
Session & Time Tools
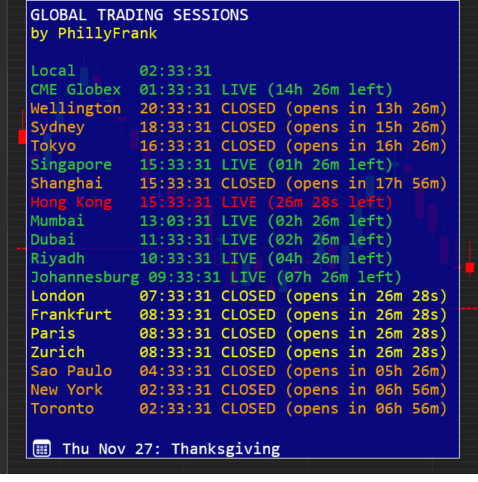
WorldClock
"Which markets are ACTUALLY open right now - and why?"
A full market-calendar engine embedded in NinjaTrader. Not just a clock - it's 5 years of validated holiday logic (2026-2030) for 18+ global exchanges.
- Real-time LIVE/CLOSED/MAINTENANCE status for NYSE, CME, LSE, JPX, and more
- CME Globex handled correctly: Sunday opens, evening re-opens, early closes
- Countdown timers to next session transition
- Holiday awareness with same-day and next-day alerts
- DST boundary handling for US and international markets
LocalClock
"I just need to see the time - on the chart - without leaving my workspace."
When NinjaTrader charts go fullscreen or overlap the taskbar, the system clock disappears. This indicator puts the time back where traders can actually see it.
- Clean, always-visible digital clock directly on your chart
- Multiple timezone support (Local, UTC, or custom)
- 12-hour or 24-hour format with optional seconds
- Flexible positioning: top/center/bottom, left/center/right
- DirectX rendering - no flicker, no lag
FloatingLocalClock
Draggable floating clock overlay showing multiple time zones on your chart.
- Display local time and up to 3 additional time zones
- Draggable positioning anywhere on chart
- Customizable colors and font
FloatingBarTimer
Shows countdown timer for current bar completion, floating near the active bar.
- Supports Tick, Minute, and Second chart types
- Floats dynamically near current bar
- Customizable font and positioning
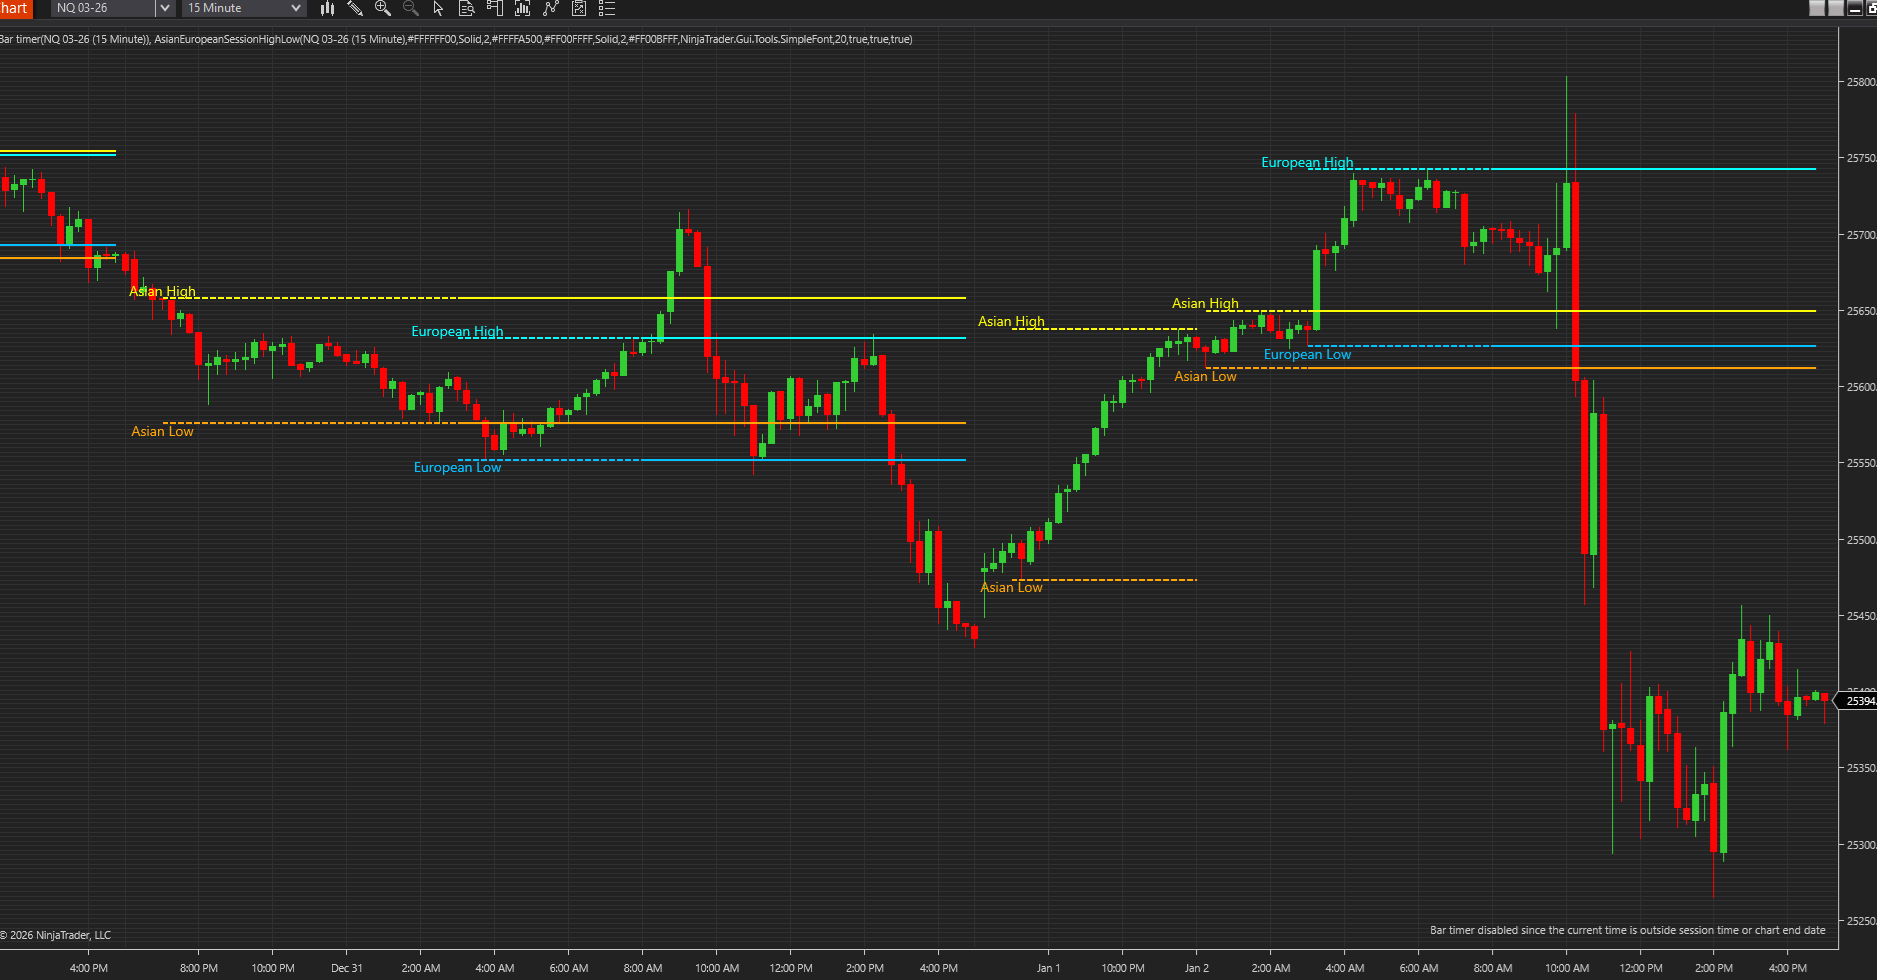
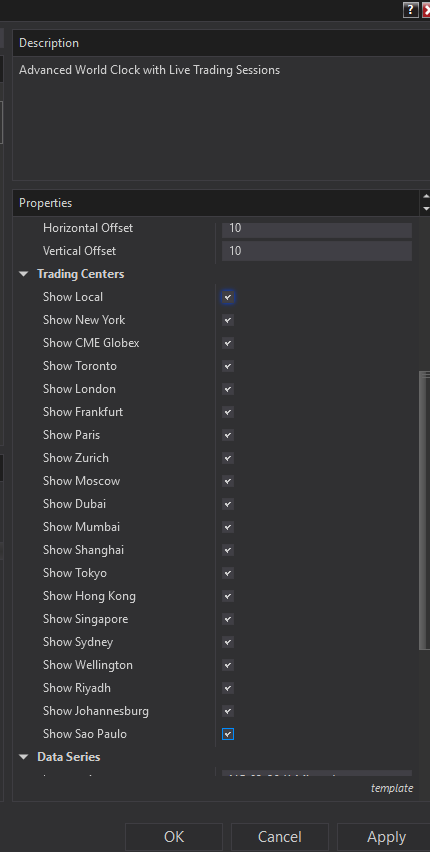
AsianEuropeanNYSessionHighLow
"If you're trading without knowing where Asia, Europe, and NY actually did business, you're trading blind."
Precisely tracks and plots true Asian (7pm-3am ET), European (3am-8am ET), and New York (9:30am-4pm ET) session highs/lows using CME Globex trading-day logic, not naive calendar days.
- All three major sessions tracked: Asian, European, and NY
- CME Globex 5:00 PM ET trading-day rollover handled correctly
- Dashed lines while session develops, solid when complete
- Sunday evening opens and overnight sessions handled
- Fully configurable colors, widths, styles, and labels per session
- Exposes values programmatically for strategies/scanners
Analysis Tools
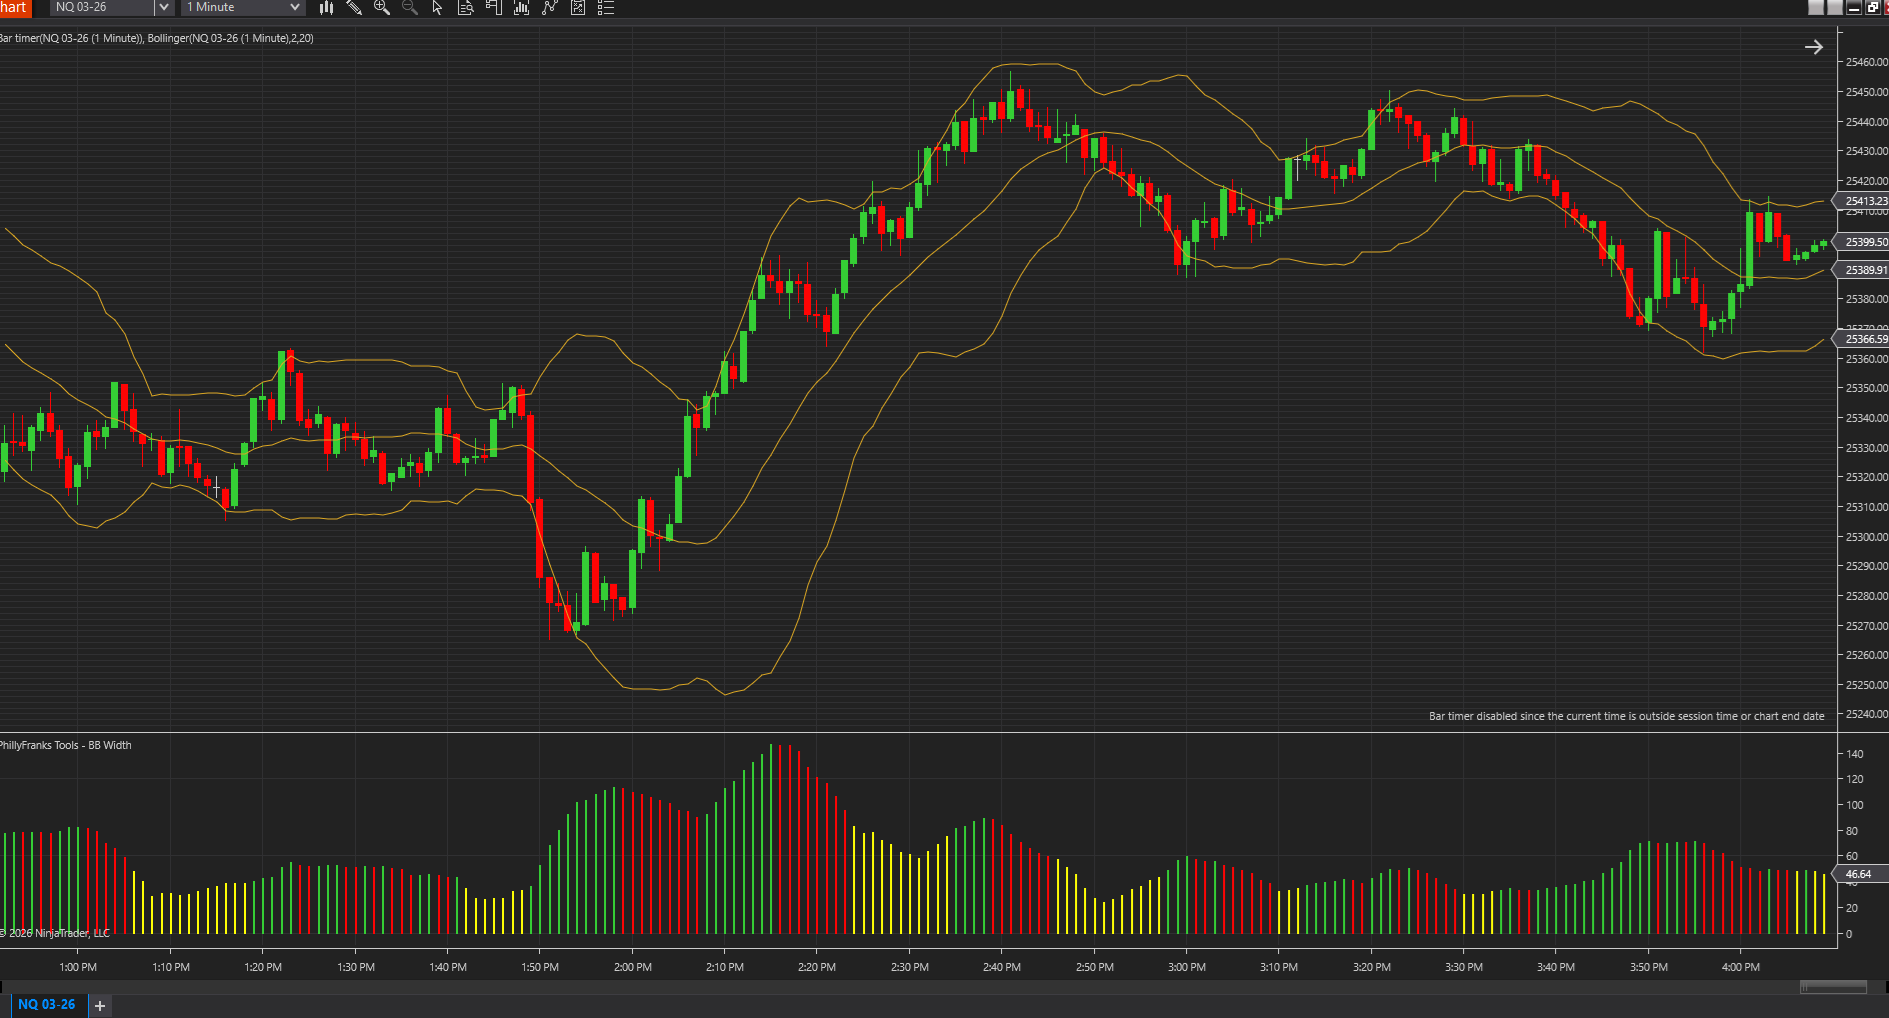
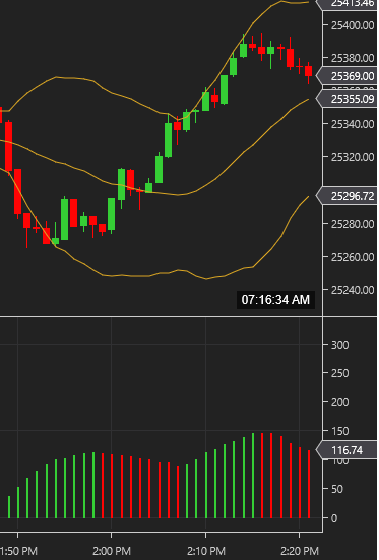
BollingerBandWidth
"Volatility tells the truth before price does."
A volatility state engine - not just a histogram. Measures true distance between Bollinger Bands and visualizes expansion, contraction, and squeeze conditions with clean color logic.
- Dynamic coloring: Green (expanding), Red (contracting), Yellow (squeeze)
- Intelligent squeeze detection using rolling average, not hardcoded magic numbers
- Works on tick, minute, and range charts
- Display as histogram bars or line graph
- Keltner Channel squeeze method available
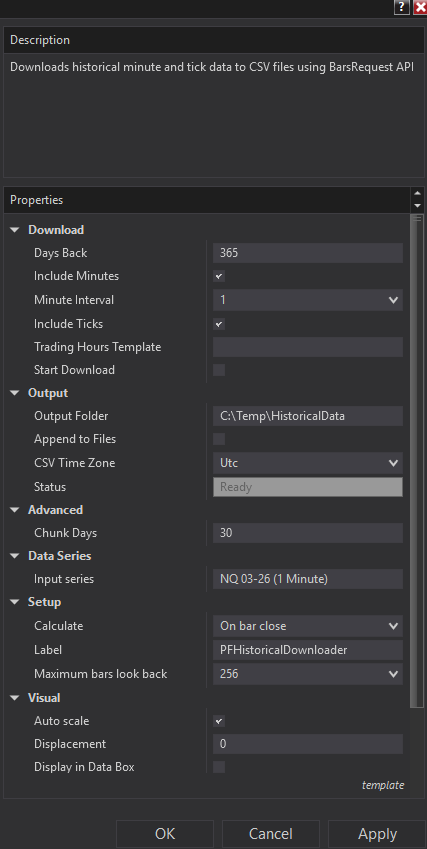
PFHistoricalDownloader
"If your edge depends on clean historical data, this tool exists for you."
A data pipeline component that extracts historical minute and tick data directly from NinjaTrader's data engine to clean, analysis-ready CSV files.
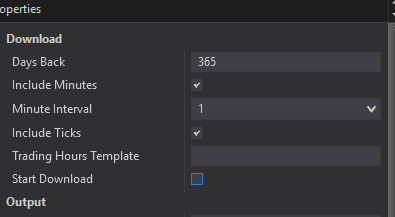
- Downloads minute bars (1m/5m/15m) and tick data via official BarsRequest API
- Chunked, throttled requests - safely pull months or years of data
- Clean CSV output: Unix timestamps (ms), ISO-8601, OHLCV
- Respects instrument trading hours, prevents phantom bars
- Thread-safe file writing, automatic retry tolerance
AddOns
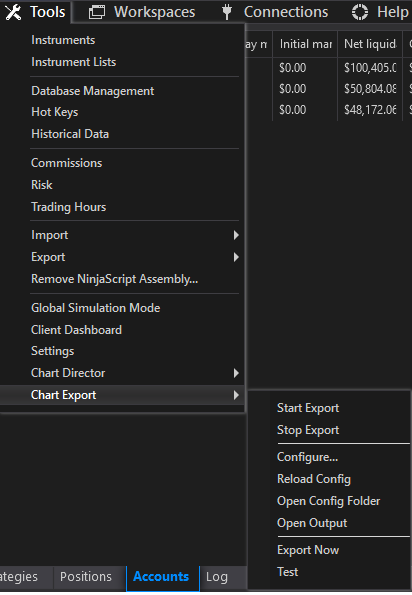
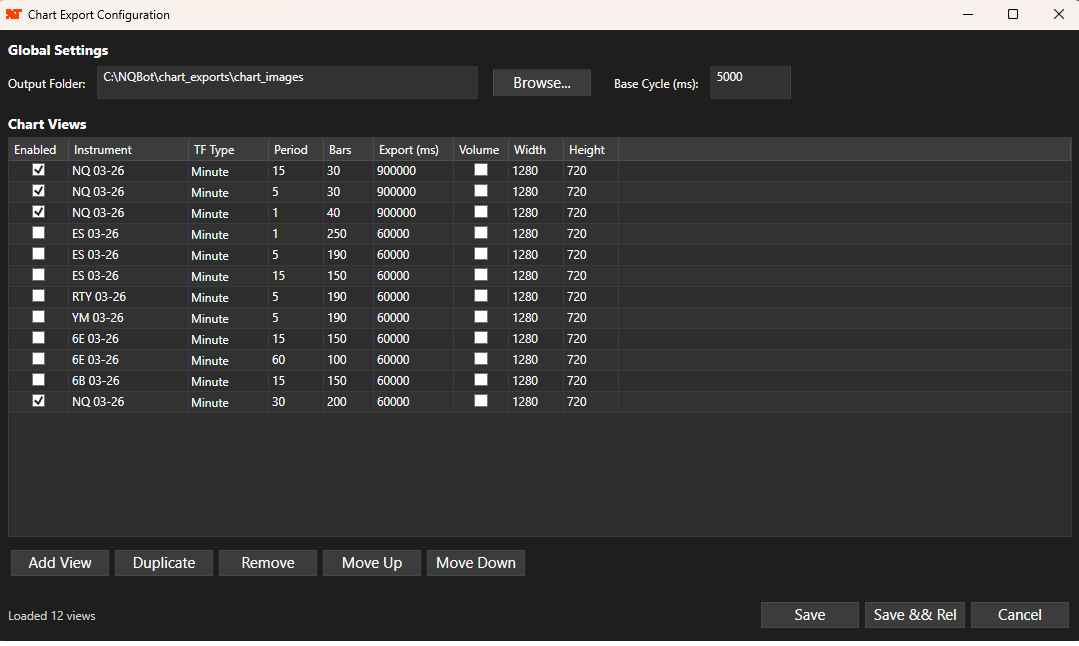
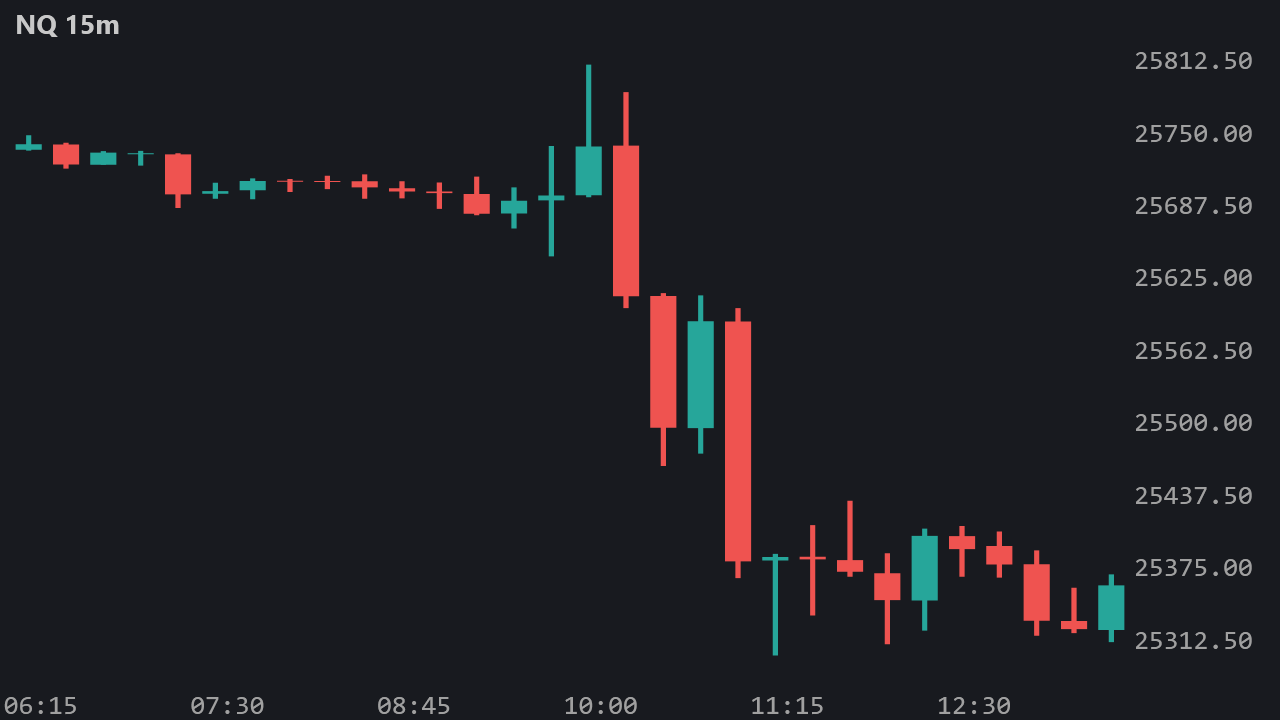
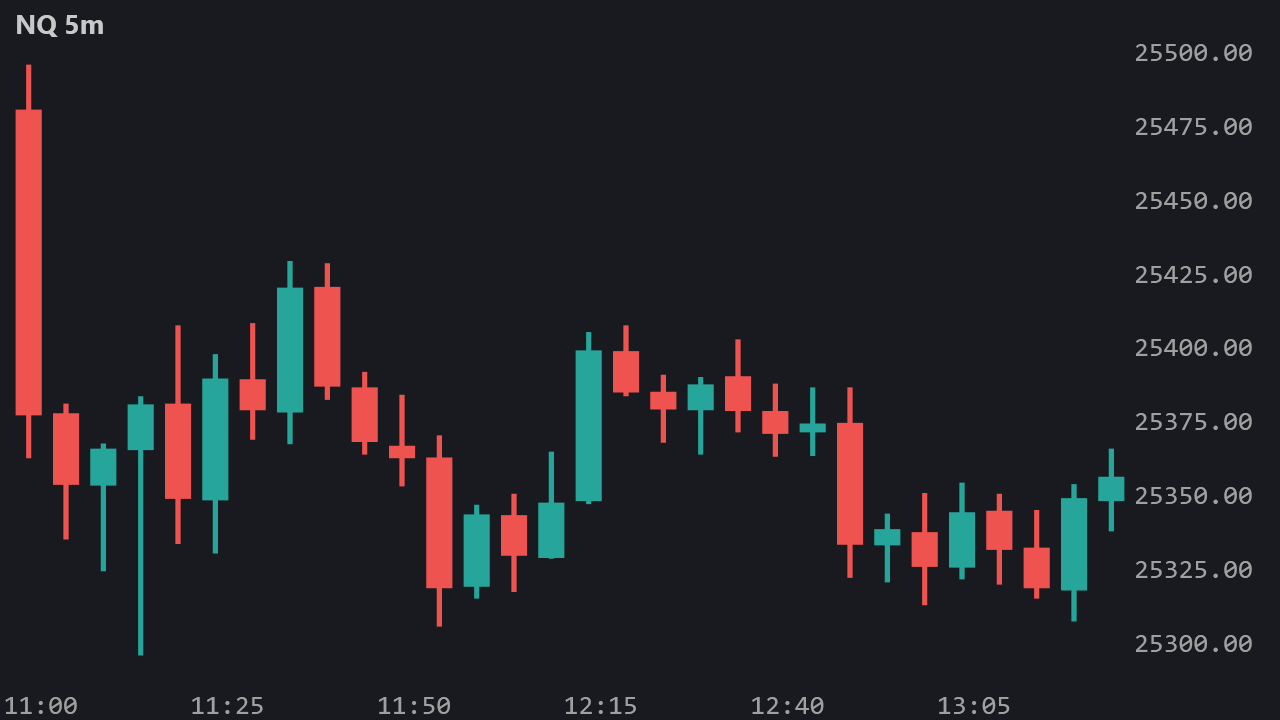
ChartExportAddOn AddOn
"Export NinjaTrader charts as PNG images for AI/ML vision model analysis."
Automatic chart export with off-screen rendering - works even when NT8 is minimized. Designed for AI vision systems that need clean, consistent chart images.
- Exports on bar close, not fixed intervals (intelligent detection)
- Multiple instruments and timeframes simultaneously
- Off-screen WPF rendering - no visible windows required
- Tick-aligned price axis respects native tick size
- JSON metadata with timestamps and bar times
- Archive system for images for the purpose of AI training
- GUI configuration via Tools menu with DataGrid editor
Installation Instructions
- Download the
.zipfile for the indicator you want - Extract the
.csfile from the zip - Copy the
.csfile to:Documents\NinjaTrader 8\bin\Custom\Indicators\ - Restart NinjaTrader 8, or compile manually via Tools → New NinjaScript → Compile
- Add indicators to charts: Right-click chart → Indicators → Look under PhillyFranksTools
For AddOns: Use Tools → Import → NinjaScript Add-on... and select the ZIP file directly.